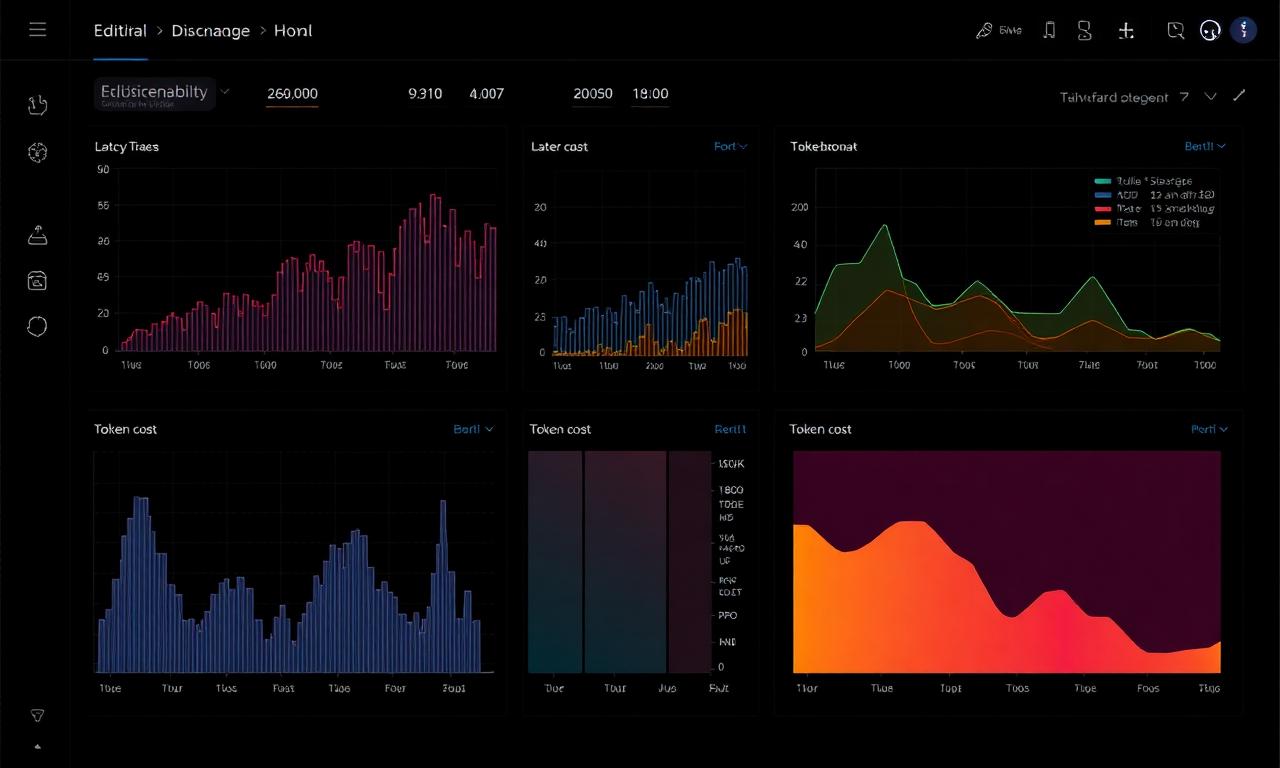
Application performance monitoring grew up around request-response services with well-defined success criteria. LLM applications have neither: a 200-OK response can be a hallucination, and a slow response can be a better answer. The observability stack has been catching up.
What traditional APM misses
Latency, error rate, and throughput are still necessary, but they are wildly insufficient. An LLM application can be fast, error-free, and wrong. It can be slow, error-prone, and still delivering the best available answer. Without additional signals, on-call engineers cannot distinguish 'the system is fine' from 'the system is quietly regressing.'
The gap is not merely quantitative. It is a category of failure — silent quality drift — that traditional APM was never designed to detect.
The four signals that actually matter
Beyond the usual RED metrics, LLM applications need four additional families of instrumentation.
- Quality signals: automated evaluations run continuously against a held-out set of representative prompts, tracked per model version.
- Cost signals: token consumption, cache hit rate, and per-request cost attributed to features and user segments.
- Behavioral signals: retry rates, tool-call success rates, refusal rates, and guardrail trigger rates.
- User signals: thumbs, session length, follow-up rate, and abandonment — grouped so that the tail of unhappy users is visible.
Tracing across a non-deterministic pipeline
A modern LLM request is a graph: retrieval, reranking, tool calls, model calls, post-processing. Traditional distributed tracing works, but the span attributes need to expand: which model version, which prompt template, which retrieval index, which safety filter fired. A trace without these fields is useless during an incident.
The single most common operational mistake is under-instrumenting the boundary between retrieval and generation. Bad retrieval and good generation look identical in ordinary logs; only span-level evidence separates them.
“In a traditional service, the trace tells you what happened. In an LLM service, the trace tells you what to look at while you decide whether what happened was good.”
The evaluation loop
The observability system is only as good as the evaluation it is measuring against. Teams that treat evaluations as a one-time exercise fall behind rapidly; teams that treat them as a living asset — versioned, expanded on every incident, run automatically on every deploy — build the discipline that makes LLM systems operable.
The best-run programs also invest in human review: a small, steady sampling of production traffic reviewed by a rotating on-call rotation. Nothing replaces the calibration that comes from watching real users interact with the system.
Where the tooling is going
Vendor and open-source LLM observability platforms have consolidated around a common vocabulary: traces, evaluations, and drift monitors. The next frontier is causal analysis — automatically identifying which change (prompt, model, index, filter) caused a metric to move. That capability is emerging but not yet reliable. Until it arrives, disciplined change management remains the operator's best tool.
Key Topics
Extended Knowledge
- Continuous evaluation against a curated golden set is the closest LLM applications have to unit tests in production.
- Retrieval-generation boundary tracing is the highest-leverage area to over-instrument early.
- Human review sampling remains an irreplaceable calibration mechanism.
Frequently Asked
No. Thumbs are noisy, biased toward vocal users, and lag real degradations. They are one signal among four families.
Large enough to be statistically meaningful (typically hundreds of examples per critical workflow) and curated enough to represent real failure modes, not just easy cases.
Under-instrumenting retrieval. Most 'model quality' incidents are actually retrieval incidents in disguise.